Power BI is a business analytics solution from Microsoft that comes bundled with the E5 enterprise license for Microsoft 365 or is available on a standalone basis. It can be considered as part of the 365 universe and provides powerful opportunities to present data in attractive dashboards from Office 365 tools and services, and beyond.
Power BI can be extremely effective for any digital workplace and we often advise clients on how they may be able to take advantage of its capabilities. It has also been an integral component of some of the solutions we have delivered.
To give clients an overview of Power BI and its possibilities, weve written this article to explain exactly what Power BI is and how you can use it in your business. This is part of our occasional blog series on the fundamentals of the individual parts of the Microsoft 365 universe. You may also be interested in our posts on Microsoft Teams, Microsoft Graph, PowerApps and Flow (being rebranded as Power Automate). Please note that events move pretty fast in the Microsoft world these days the details in this article were correct at the time of writing, as far as were aware.
What is Power BI?
Microsoft itself describes Power BI as a business analytics solution that lets you visualise your data and share insights across your organisation, or embed them in your app or website. It is positioned as one of the three main tools of the Power Platform, emphasising the advantages of integrating capabilities with apps (via Power Apps) and workflow / automation (via Power Automate).
Power BI helps organisations:
- Create dashboards of data from multiple sources
- Publish related reports
- Share these across your organisation to support operations, decision-making and more
- Access this information from either desktop or mobile devices.
There are currently two levels of licensing Power BI Pro, a simpler, self-service platform and Power BI Premium, an enterprise-level service covering more advanced delivery and analytics, as well as extras like the ability to tap into some of Microsoft AI and machine learning frameworks. The Pro level comes bundled with the E5 level of Office 365 subscription, while the latters pricing is calculated on a by case basis. The levels of licensing really determine what youre able to do so its worth investigating this fully before you go and sign up to anything.
Features
PowerBI comes with a strong set of capabilities to deliver dashboards and reporting, that can really help disseminate the way you visualise data and business intelligence around your organisation and make it actionable. In fact, Power BI is an excellent way to democratise your data. Features include:
- The ability to create an array of dashboards, reports and other data visualisations.
- Access to a library of visual elements, wider visualisations and themes, as well as a kit to create custom visuals.
- A library of data connectors for other data sources, both in the cloud and on-premises.
- Tools to help you prepare the data (potentially from multiple sources) for visualisation and reporting.
- Robust reporting and export capabilities including print and excel options, as well as the ability to embed content in SharePoint, Teams and other systems.
- The ability to interact with and personalise BI content.
- Access to the Power BI mobile app.
- Report subscriptions and notifications.
- AI-powered data modelling (Premium only).
How can my organisation use PowerBI?
Power BI allows you to create data visualisations and reports that can be applied to a variety of use cases. More or less anything that requires regular, real-time reporting and needs to display data from a variety of systems and applications (from the Microsoft stack and beyond) is perfect for Power BI. This arms organisations with the ability to actually track processes and monitor data that was previously very difficult to do and can genuinely transform decision-making in your organisation.
Successful data visualisation can also help to galvanise action and get people to use data more comprehensively in the way they work; a well-thought out dashboard can be considerably more powerful than rows and rows of numbers presented in a spreadsheet.
Data visualisation can be targeted at the individual, team and even organisational level. Personalisation and interrogation options within Power BI help to ensure this can happen. For example:
- Individually an employee may want to have a dashboard of all my personal HR and KPI data, covering everything from how many days of annual leave I have left to my time utilisation on projects.
- At the team level particular functions may need data to perform key roles and processes, for example IT monitoring or displaying data for management teams.
- At the enterprise level you may want to use Power BI to display key organisational KPIs such as annual sales or health & safety statistics on your intranet homepage, using data to promote and underpin organisational priorities.
Even more use cases
Our popular article 19 business processes you can automate using Office 365 and Wizdom, includes several use cases that incorporates use of Power BI:
- IT and facilities performance monitoring to keep on top of anything from load times on different web channels and services to the temperature in different parts of your office.
- The ability to report on Office 365 adoption, helping your digital workplace team roll out the suite of tools in a more targeted and efficient way.
- Financial reporting and monitoring supporting decision-making for senior management.
- Tracking and managing IT assets including devices, equipment, software licenses and more, and visualising the appropriate data.
- Visualising the Know Your Client due diligence process to on-board new clients, suppliers and vendors, and minimise risks involved.
- Dashboards for resource planning, for example to view information from a variety of different sources including your HR or ERP system, your timecard system and project planning software.
- Creating project management dashboards to report project information and progress, incorporating data from different systems.
Its also worth noting that you can also use Power BI to present information externally, for example to customers on your website.
How weve helped clients
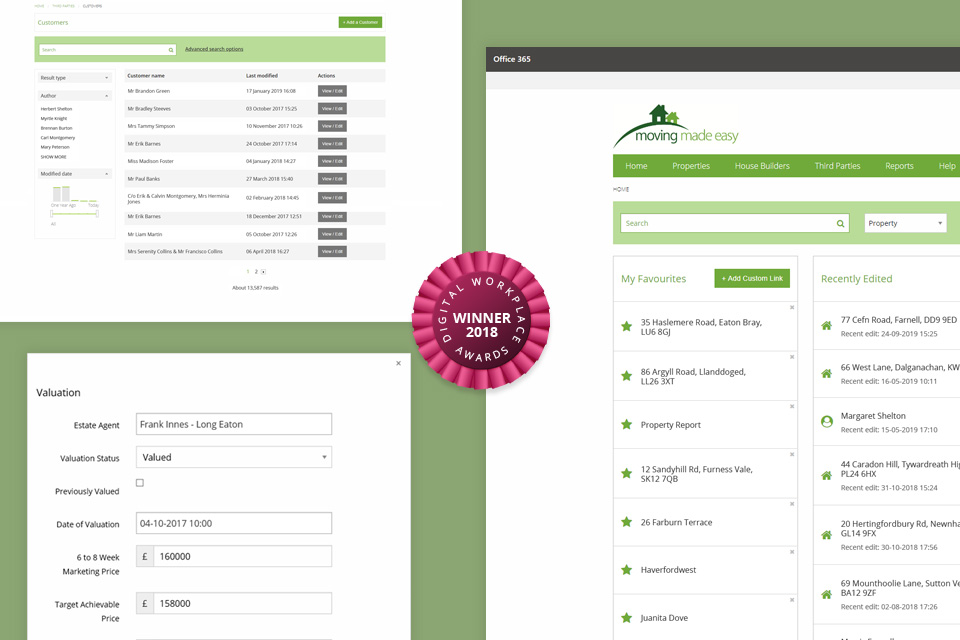
We regularly use Power BI to deliver solutions to our clients. Were particularly proud of the award-winning work we carried out for Moving Made Easy, a property company that uses a custom-built Office 365 digital workplace to manage the end-to-end property selling process. Within this Power BI is used to provide management and customers with a real time view of important data including the number of close deals in the week and contact reports showing the details of all property valuations and viewings.
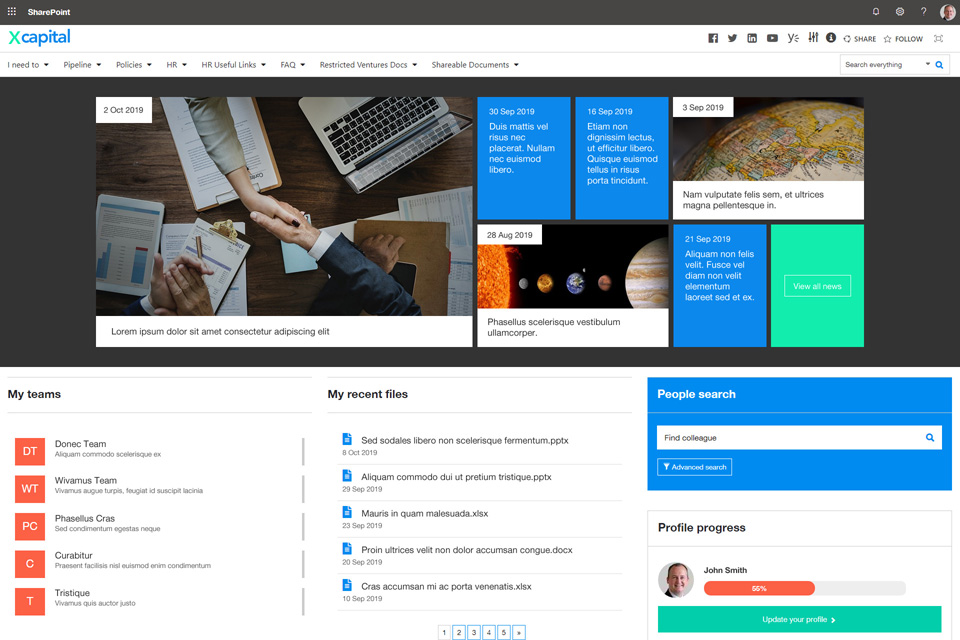
At Xcaptial, a UK-based private equity house, we built a custom Office 365 and Teams based solution to track the process for identifying and assessing acquisitions. Using Power BI. we delivered new attractive reporting capabilities meaning managers now get an overview of the entire opportunity pipeline.
Future capabilities
Microsoft continues to invest in Power BI with regular improvements on the roadmap and announcements on the blog. For example, in the past few weeks there have been releases or announcements relating to:
- improvements to the interface
- greater integration across the Power Platform
- new data connectors to the system
- major new data protection and information management capabilities
- new models to help manage large datasets
- and more!
If youre investing in Power BI you can be very confident that Microsoft will continue to invest in the product and increase what it can do. For example, the future ability to build AI into even more intelligent dashboards is genuinely exciting.
Should you use Power BI?
Yes! As we all generate more and more data, organisations need to be in a position to leverage it to seize the competitive advantage. Power BIs flexibility and strong data visualisation means almost all organisations will be able to find multiple ways to build dashboards and present data in ways that will really make a difference.
If youd like to discuss with us how you can use Power BI to help your business then get in touch!